Business Analysis: BPM
Introduction
1. Business Modeling tools
2. Define process modeling
3. Overview of modeling tools
4. Modeling consistency and standards
Consistency and simplicity
- Easy to read
- Capture processes
- Foundation for other models
- Represent current state
Create Effective Models
- Train modelers
- Explain models to attendees
- Check if work has already been done
- Start with what you know
1. Context Diagram
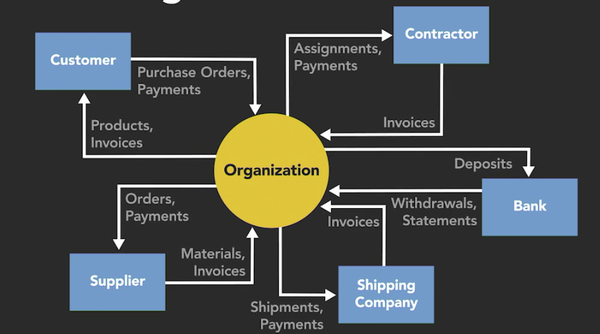
1. The purpose of the context diagram
- provide a visual view
- Are high level
- Serve as a checklist
- Are at-a-glance tools
- Understand relationships
- Understand functions
2. Context diagram features
- Entities
- Relationships
- Processes
3. How to create a context diagram
Research
- search intranet
- Ask questions
- Run workshop
Creation
- Start with main entity
- Add external stakholders
- Connect relationships
4. Pitfalls of context diagrams
- Unconscious incompetence: I don't know what I don't know.
- Conscious incompetence: I know that I don't know.
- Conscious competence: I know and it shows.
2. Functional Flow Diagram
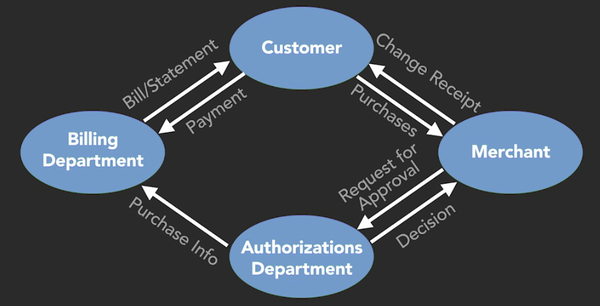
1. The purpose of the Functional Flow Diagram
- Shows internal areas in your organization and how they interact in the overall workflow
- Target audiences
- Validate stakeholders
- Who PERFORMS the activities
- What TRIGGERS activities
- How much TIME to completion
2. Functional Flow Diagram features
- Provide a quick overview
- Are useful for training
- Create consensus
- Identify improvement opportunities
- Are easy to learn
3. How to create a functional flow diagram
- Focus on a single entity
- choose the interaction to focus on
- Run high-level process workshops
Step
- Circles represent each functional area
- Arrows illustrate relationships
- Arrows labels identify what is exchanged
4. Pitfalls of Functional Flow Diagram
- Not validating initial directional flows
- Not validating coverage
- Assuming involvement
- Not keeping participants at the functional level
3. Cross-Functional Flow Diagram
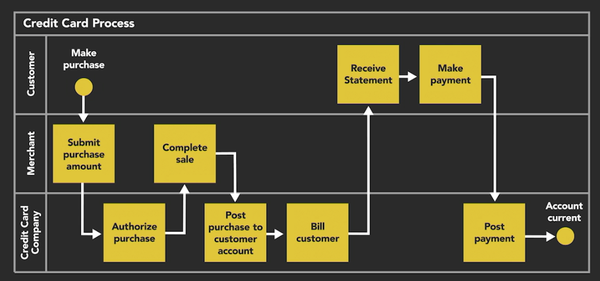
1. The purpose of the Cross-Functional Flow Diagram
- Step-by-step workflows can be broken down into sub-processes.
2. Cross-Functional Flow Diagram features
- Terminator
- Rectangle
- Parallel lines
- Plus symbol
- Diamond
- Arrow
3. How to create Cross-Functional Flow Diagram
also Exception Flows
- Challenges and unforeseen problems occur and prevent a function from being completed.
4. Pitfalls of Cross-Functional Flow Diagram
- Starting without understanding functions
- Adding too much detail
- Overconfusing with too much information
Best Practices
- Educate project teams
- Ensure everyone is on the same pages
- Align expectations
- Be consistent
- Limit number of shapes used
- Share diagram with stakeholders
- Plan for interactions, reworks, and additional discussions
- Send documentation ahead of time
- Ensure version control
- Authorize stakeholders to validate and sign off
4. Flow Chart Diagram
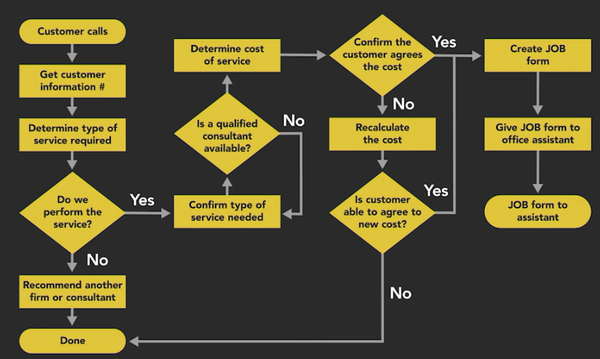
1. The purpose of the Flow Chart Diagram
Benefits
- Break down complex processes
- Identify inefficiencies
- Serve as single source of truth
- Support creation of test scripts
- Ensure consistent outcome
KRAC model
- Keep
- Remove
- Add
- Change
Impact Assessment
Identify what has changed and analyze impacts to existing functional areas.
2. Flow Chart Diagram features
Activities
- Taught
- Assessed
- Refined
- Updated
Features
- No interaction with other functional areas
- Can flow in any direction
- Use standard symbols
3. How to create Flow Chart Diagram
- track back to Cross-Functional flow chart
4. Pitfalls of Flow Chart Diagram
- Trying to create a hybrid version
- Not understanding context before starting
Best Practices
- Educate your project teams
- Ensure everyone is on the same page
- Align expectations
- Don't assume anything
- Engage your stakeholders
Put It All Together
How to determine which diagram to use and why
Put modeling into action
- What is the area of focus
- What already exists
- Who is the end user
- How will the information be used
- Target SME audiences to meet needs
- Use whiteboard stick memo