Amazon SageMaker
Table of contents
1. Introduction
- What Sagemaker looks like
- Notebooke
- Training
- Algorithms
- Training jobs
- Hyperparameter tuning jobs
- Inference
- Models
- Endpoint config
2. Analyze Data
- import data
- Investigate data
- Data visualization: Categories(skip it, becuase we use plotly)
- Data visualization: Numerical
- Data summary tools
pd.describe().T pd.crosstab(churn['Churn?'], churn['Vmail Plan']) - Describe a dataset
3. Build Models
-
Cleaning up the data
- Preparing the model training set
- Model training
from sagemaker.amazon.amzon_estimator import get_image_uri container = get_image_uri(boot3.Session().region_name, 'xgboost') - Checking model training results
- Train a basic model
4. Deploy Models
- Deploy trained Model
- Test deployed model for single record
- Test deployed model for multiple records
- Transfer model to server ```python transformaer = sagemaker.transformer.Transformer( base_transform_job_name =
)
- Review the accuracy of the model


---
## 脱離事例分析

お客様の脱離は、どんなビジネスにとっても、望ましくないことである。現在の客様の事情を分析し、満足/不満状況から脱退ことを予測する。

例として、キャリアのユーザが脱退事例データ(Churn Dataset)を使い、機械学習を通し(Training)脱離予測モデルを構築する。データ項目は以下の通りです。

- State: the US state in which the customer resides, indicated by a two-letter abbreviation; for example, OH or NJ
- Account Length: the number of days that this account has been active
- Area Code: the three-digit area code of the corresponding customer's phone number
- Phone: the remaining seven-digit phone number
- Int'l Plan: whether the customer has an international calling plan: yes/no
- VMail Plan: whether the customer has a voice mail feature: yes/no
- VMail Message: presumably the average number of voice mail messages per month
- Day Mins: the total number of calling minutes used during the day
- Day Calls: the total number of calls placed during the day
- Day Charge: the billed cost of daytime calls
- Eve Mins, Eve Calls, Eve Charge: the billed cost for calls placed during the evening
- Night Mins, Night Calls, Night Charge: the billed cost for calls placed during nighttime
- Intl Mins, Intl Calls, Intl Charge: the billed cost for international calls
- CustServ Calls: the number of calls placed to Customer Service
- Churn?: whether the customer left the service: true/false

最後の項目「Churn?」は、実際脱離かしないかの結果である。

## Amazon SageMaker Studio Walkthrough
_**Using Gradient Boosted Trees to Predict Mobile Customer Departure**_

---

This notebook walks you through some of the main features of Amazon SageMaker Studio.

* [Amazon SageMaker Experiments](https://docs.aws.amazon.com/sagemaker/latest/dg/experiments.html)
  * Manage multiple trials
  * Experiment with hyperparameters and charting
* [Amazon SageMaker Debugger](https://docs.aws.amazon.com/sagemaker/latest/dg/train-debugger.html)
  * Debug your model
* [Model hosting](https://docs.aws.amazon.com/sagemaker/latest/dg/how-it-works-hosting.html)
  * Set up a persistent endpoint to get predictions from your model
* [SageMaker Model Monitor](https://docs.aws.amazon.com/sagemaker/latest/dg/model-monitor.html)
  * Monitor the quality of your model
  * Set alerts for when model quality deviates

Run this notebook from within Studio. For Studio onboarding and set up instructions, see [README](/README.md).

---

## Contents

1. [Background](#Background) - Predicting customer churn with XGBoost
1. [Data](#Data) - Prep the dataset and upload it to Amazon S3
1. [Train](#Train) - Train with the Amazon SageMaker XGBoost algorithm
  - [Amazon SageMaker Experiments](#Amazon-SageMaker-Experiments)
  - [Amazon SageMaker Debugger](#Amazon-SageMaker-Debugger)
1. [Host](#Host)
1. [SageMaker Model Monitor](#SageMaker-Model-Monitor)

---

## Background

_This notebook has been adapted from an [AWS blog post](https://aws.amazon.com/blogs/ai/predicting-customer-churn-with-amazon-machine-learning/).

Losing customers is costly for any business.  Identifying unhappy customers early on gives you a chance to offer them incentives to stay.  This notebook describes using machine learning (ML) for automated identification of unhappy customers, also known as customer churn prediction. It uses Amazon SageMaker features for managing experiments, training the model, and monitoring the deployed model.

Let's import the Python libraries we'll need for this exercise.

```python
# 必要なライブラリをインストール
import sys
!{sys.executable} -m pip install -qU awscli boto3 "sagemaker>=1.71.0,<2.0.0"
!{sys.executable} -m pip install sagemaker-experiments
# import
import pandas as pd
import numpy as np
import matplotlib.pyplot as plt
import io
import os
import sys
import time
import json
from IPython.display import display
from time import strftime, gmtime
import boto3
import re


import sagemaker
from sagemaker import get_execution_role
from sagemaker.predictor import csv_serializer
from sagemaker.debugger import rule_configs, Rule, DebuggerHookConfig
from sagemaker.model_monitor import DataCaptureConfig, DatasetFormat, DefaultModelMonitor
from sagemaker.s3 import S3Uploader, S3Downloader

from smexperiments.experiment import Experiment
from smexperiments.trial import Trial
from smexperiments.trial_component import TrialComponent
from smexperiments.tracker import Tracker
Data
モバイルキャリアの解約履歴データを学習し、顧客離脱予測モデルを構築する。
データは Daniel T. Larose提供、カリフォルニア大学Machine Learning Datasetsに寄与されている。
# Set the path we can find the data files that go with this notebook
%cd /root/amazon-sagemaker-examples/aws_sagemaker_studio/getting_started
local_data_path = './data/training-dataset-with-header.csv'
data = pd.read_csv(local_data_path)
pd.set_option('display.max_columns', 500)     # Make sure we can see all of the columns
pd.set_option('display.max_rows', 10)         # Keep the output on one page
data
S3にアップロード
account_id = sess.client('sts', region_name=sess.region_name).get_caller_identity()["Account"]
bucket = 'sagemaker-studio-{}-{}'.format(sess.region_name, account_id)
prefix = 'xgboost-churn'

try:
    if sess.region_name == "us-east-1":
        sess.client('s3').create_bucket(Bucket=bucket)
    else:
        sess.client('s3').create_bucket(Bucket=bucket,
                                        CreateBucketConfiguration={'LocationConstraint': sess.region_name})
except Exception as e:
    print("Looks like you already have a bucket of this name. That's good. Uploading the data files...")

# Return the URLs of the uploaded file, so they can be reviewed or used elsewhere
s3url = S3Uploader.upload('data/train.csv', 's3://{}/{}/{}'.format(bucket, prefix,'train'))
print(s3url)
s3url = S3Uploader.upload('data/validation.csv', 's3://{}/{}/{}'.format(bucket, prefix,'validation'))
print(s3url)
Train
Let's move on to training. We'll training a class of models known as gradient boosted decision trees on the data that we just uploaded using the XGBoost library.
Because we're using XGBoost, we'll first need to specify the locations of the XGBoost algorithm containers.
from sagemaker.amazon.amazon_estimator import get_image_uri
docker_image_name = get_image_uri(boto3.Session().region_name, 'xgboost', repo_version='0.90-2')

# Then, because we're training with the CSV file format, we'll create `s3_input`s that our training function can use as a pointer to the files in S3.

s3_input_train = sagemaker.s3_input(s3_data='s3://{}/{}/train'.format(bucket, prefix), content_type='csv')
s3_input_validation = sagemaker.s3_input(s3_data='s3://{}/{}/validation/'.format(bucket, prefix), content_type='csv')
Amazon SageMaker Experiments
Amazon SageMaker Experiments allows us to keep track of model training; organize related models together; and log model configuration, parameters, and metrics so we can reproduce and iterate on previously trained models and compare models. We'll create a single experiment to keep track of the different approaches to training the model that we'll try.
Each approach or block of training code we run will be an experiment trial. Later, we'll compare different trials in Studio.
Let's create the experiment.
sess = sagemaker.session.Session()

create_date = strftime("%Y-%m-%d-%H-%M-%S", gmtime())
customer_churn_experiment = Experiment.create(experiment_name="customer-churn-prediction-xgboost-{}".format(create_date),
                  description="Using xgboost to predict customer churn",
                  sagemaker_boto_client=boto3.client('sagemaker'))
Hyperparameters
Now, we can specify our XGBoost hyperparameters, including the following key hyperparameters:
max_depthControls how deep each tree within the algorithm can be built. Deeper trees can lead to better fit, but are more computationally expensive and can lead to overfitting. Typically, you need to explore trade-offs in model performance between using a large number of shallow trees and a smaller number of deeper trees.subsampleControls training data sampling. This hyperparameter can help reduce overfitting, but setting it too low can also starve the model of data.num_roundControls the number of boosting rounds. This is essentially the number of subsequent models that are trained using the residuals of previous iterations. More rounds can produce a better fit on the training data, but can be computationally expensive or lead to overfitting.etaControls how aggressive each round of boosting is. Larger values lead to more conservative boosting.gammaControls how aggressively trees are grown. Larger values lead to more conservative models.min_child_weightAlso controls how aggresively trees are grown. Large values lead to a more conservative algorithm.
For more details, see XGBoost's hyperparameters GitHub page.
hyperparams = {"max_depth":5,
               "subsample":0.8,
               "num_round":600,
               "eta":0.2,
               "gamma":4,
               "min_child_weight":6,
               "silent":0,
               "objective":'binary:logistic'}
Trial 1 - XGBoost in algorithm mode
For our first trial, we'll use the built-in xgboost container to train a model without providing additional code. This way, we can use XGBoost to train and deploy a model as we would with other Amazon SageMaker built-in algorithms.
We'll create a new trial object for this trial and associate the trial with the experiment that we created earlier. To train the model, we'll create an estimator and specify a few parameters, such as the type of training instances we'd like to use and how many and where to store the trained model artifacts.
We'll also associate the training job with the experiment trial that we just created (when we call estimator.fit).
trial = Trial.create(trial_name="algorithm-mode-trial-{}".format(strftime("%Y-%m-%d-%H-%M-%S", gmtime())),
                     experiment_name=customer_churn_experiment.experiment_name,
                     sagemaker_boto_client=boto3.client('sagemaker'))

xgb = sagemaker.estimator.Estimator(image_name=docker_image_name,
                                    role=role,
                                    hyperparameters=hyperparams,
                                    train_instance_count=1,
                                    train_instance_type='ml.m4.xlarge',
                                    output_path='s3://{}/{}/output'.format(bucket, prefix),
                                    base_job_name="demo-xgboost-customer-churn",
                                    sagemaker_session=sess)

xgb.fit({'train': s3_input_train,
         'validation': s3_input_validation},
        experiment_config={
            "ExperimentName": customer_churn_experiment.experiment_name,
            "TrialName": trial.trial_name,
            "TrialComponentDisplayName": "Training",
        }
       )
Review the results
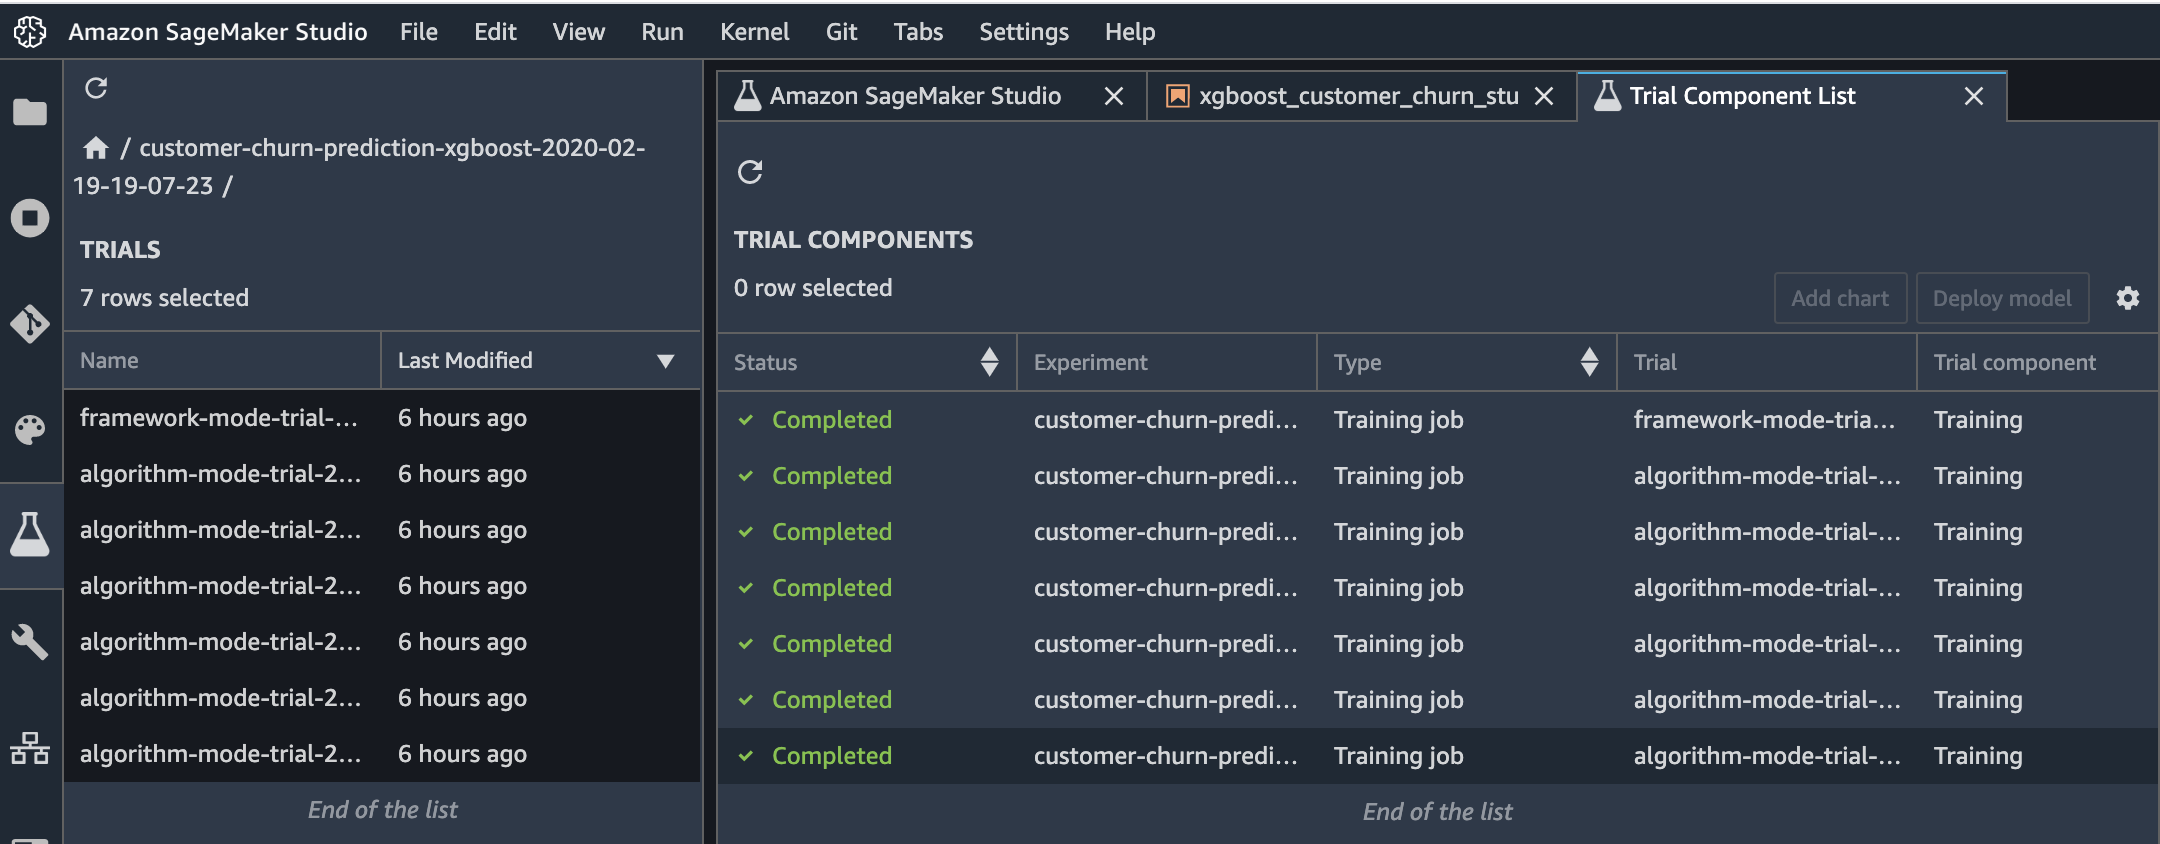
After the training job succeeds, you can view metrics, logs, and graphs for the trial on the Experiments tab in Studio.
To view them, choose the Experiments button. (表示されてない場合は、正しくTrainingできていないこと)
![]()
To see the components of a specific experiment, in the Experiments list, double-click it. If you want to see the components of multiple experiments, select them with Ctrl-click, then right-click on an experiment to see the context menu. To see all of the compenents together, choose "Open in trial component list". This enables charting across experiments.
The components are sorted so that the best model is at the top.
Download the model
You can also find and download the model that was trained. To find the model, choose the Experiments icon in the left tray, and keep drilling down through the experiment, the most recent trial, and its most recent component until you see the Describe Trial Components page. To see links to the training and validation datasets, choose the Artifacts tab. The links are listed in the "Input Artifacts" section. The generated model artifact is in the "Output Artifacts" section.